

KwickAcademy Artificial Intelligence · 7 min · free
Regression: Correlation and Linear Regression
Correlation shows how two variables move together; Pearson r lies between -1 and +1. Linear regression fits y = mx + c.
Follows the syllabus of: CBSE Class 11 Artificial Intelligence (843), CBSE Class 12 Artificial Intelligence (843)
On screen in this lesson
What is correlation?
| How strongly two variables move together |
| Positive: both rise together |
| Negative: one rises, the other falls |
| Zero: no clear link |
Pearson coefficient r
| Value of r | Meaning |
|---|---|
| +1 | perfect positive |
| close to +0.8 | strong positive |
| 0 | no linear link |
| close to -0.8 | strong negative |
| -1 | perfect negative |
Reading r correctly
| r always lies between -1 and +1 |
| The sign gives direction, the size gives strength |
| r measures only straight-line links |
| High r does not prove one thing causes the other |
Study hours and marks
| Student | Hours | Marks |
|---|---|---|
| Riya | 1 | 50 |
| Aman | 2 | 60 |
| Neha | 3 | 70 |
| Kabir | 4 | 80 |
What is linear regression?
| Fits the best straight line through the data |
| Line: y = m x + c |
| m is the slope: change in y for one step in x |
| c is the intercept: value of y when x is 0 |
The best-fit line
| No line passes through every real point |
| Error: gap between a point and the line |
| Least squares: square each error, add them up |
| Best fit: the line with the smallest total |
Quick answers
Can r be 1.5?
No. r always lies between -1 and +1.
Predicted marks for 2.5 hours with m = 9.6, c = 41?
65.
KwickClips from this lesson
Short clips, one idea each. Good for revision the night before.
 Can r be 1.5?41 sec
 What is the error?37 sec
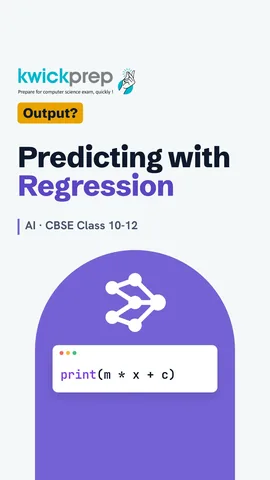 What is the prediction for 2.5 hours?36 sec
 Price of a used scooter?40 sec
The full lesson, in text
Hello students, welcome to Kwickprep. If you study one more hour a day, how many more marks can you expect? AI answers such questions with regression. Today we learn correlation and the Pearson coefficient. Then we fit a straight line, predict with it, and compare regression with classification.
Let us begin with correlation. Correlation tells us how strongly two variables move together. In a positive correlation, both rise together, like study hours and marks. In a negative correlation, one rises while the other falls, like hours of mobile gaming and marks. With zero correlation, there is no clear link, like shoe size and marks.
We measure correlation with a number called the Pearson correlation coefficient, written as small r. Plus one means a perfect positive link, where all points lie on a rising straight line. A value near plus point eight means a strong positive link. Zero means no straight line link at all. A value near minus point eight means a strong negative link. Minus one means a perfect negative link, on a falling straight line.
Keep four facts about r in mind. The value of r always lies between minus one and plus one, so an answer of one point five is always wrong. The sign tells the direction, and the size tells the strength. The Pearson coefficient only measures straight line links, so a curved pattern can have a low r. And a high r never proves that one thing causes the other.
Here is some small data from four students. Riya studied one hour a day and scored fifty. Aman studied two hours and scored sixty. Neha studied three hours and scored seventy. Kabir studied four hours and scored eighty. Every extra hour adds exactly ten marks, so all points lie on one rising line, and r is plus one. Real data is never this neat, but it makes the idea clear.
Let us make the marks a little more realistic: fifty, sixty two, sixty eight and eighty. Python's statistics module has a correlation function, available from Python three point ten. It calculates the Pearson coefficient for us. We round it to two decimal places, and get point nine nine. That is a very strong positive correlation.
Correlation tells us that a link exists. Linear regression goes further and draws the best straight line through the data. The line is written as y equals m x plus c. Here m is the slope, which is how much y changes when x goes up by one. And c is the intercept, which is the value of y when x is zero.
How do we choose the best line? In real data, no straight line passes through every point. The gap between a real point and the line is called the error. The least squares method squares each error, so negatives do not cancel positives, and adds them up. The best fit line is the one with the smallest total.
Python can fit this line for us with linear regression from the statistics module. It uses the least squares method. The slope m comes out as nine point six. So each extra hour of study adds about nine point six marks. The intercept c is forty one, the marks predicted for zero hours of study.
Now we use the line to predict. For each value of x, we calculate y equals m times x plus c. For two and a half hours, the predicted marks are sixty five. For five hours, the prediction is eighty nine. Pause and predict. What does the line say for ten hours of study?
The line says one hundred thirty seven marks for ten hours, which is impossible when the paper is out of one hundred. So a regression line can mislead outside the data it learned from. Predict only inside the range of your data, which here is one to four hours. And more, better quality data gives a more reliable line.
Both regression and classification are supervised learning, but they answer different questions. Regression outputs a number, while classification outputs a category. Regression may predict marks of seventy two point five, while classification predicts pass or fail. Regression predicts things like house rent or rainfall, while classification detects spam or a disease. We check regression by the size of its errors, and classification mainly by its accuracy.
Here are three tasks to sort out. Tomorrow's temperature in Jaipur. Whether a mango is ripe or unripe. The price of a used scooter. Pause and decide for each case, regression or classification.
The answers are regression, classification and regression, so let us revise. Correlation shows how two variables move together. The Pearson coefficient r always lies between minus one and plus one. Linear regression fits the line y equals m x plus c, using least squares. We predict by putting x into the line, but only inside the range of our data. And regression predicts a number, while classification predicts a category.
Courses that teach this
| Course | Unit |
|---|---|
| CBSE Class 10 Artificial Intelligence (417) | Part B Unit 2: Advanced Concepts of Modelling in AI |
| CBSE Class 11 Artificial Intelligence (843) | Machine Learning Algorithms |
| CBSE Class 12 Artificial Intelligence (843) | Python Programming - II (evaluated in practicals) |
Voice-over in this lesson is AI-generated. The script is written and checked by Kajal Ma'am. Boards can revise a syllabus mid-year, so confirm anything you plan around against the official board circular. Keep your passwords, OTPs and ID numbers to yourself — we never ask for them. To reach Kajal Ma'am, use the WhatsApp button; sharing your number there is how we call you back.
Free to watch, no sign-up. Live classes with Kajal Ma'am are the paid course; these lessons stay free either way.