

KwickAcademy Artificial Intelligence · 8 min · free
Model Evaluation Metrics: Confusion Matrix, Accuracy, Precision, Recall and F1
A confusion matrix counts TP, FP, FN and TN. From it we calculate accuracy, precision, recall and the F1 score. Spam example: accuracy 70%, precision 0.75, recall 0.6, F1 about 0.67.
Follows the syllabus of: CBSE Class 10 Artificial Intelligence (417), CBSE Class 12 Artificial Intelligence (843)
On screen in this lesson
What is a confusion matrix?
| A 2 by 2 table of prediction against reality |
| Counts TP, FP, FN and TN |
| Shows where the model gets confused |
Our example: 100 emails
| Model marks each email Spam or Not spam |
| 50 emails are really spam, 50 are not |
| Model caught 30 spam, missed 20 |
| Model wrongly flagged 10 good emails |
Building the matrix
| Real: Spam | Real: Not spam | |
|---|---|---|
| Predicted Spam | TP = 30 | FP = 10 |
| Predicted Not | FN = 20 | TN = 40 |
| Total | 50 | 50 |
Accuracy
| Step | Working | Value |
|---|---|---|
| Formula | (TP+TN) / Total | |
| Put values | (30+40) / 100 | 70/100 |
| Answer | as a percent | 70% |
Precision
| Step | Working | Value |
|---|---|---|
| Formula | TP / (TP+FP) | |
| Put values | 30 / (30+10) | 30/40 |
| Answer | as a decimal | 0.75 |
Recall
| Step | Working | Value |
|---|---|---|
| Formula | TP / (TP+FN) | |
| Put values | 30 / (30+20) | 30/50 |
| Answer | as a decimal | 0.6 |
Quick answers
What is the formula for recall?
TP / (TP + FN).
Which metric matters most for a disease test?
Recall, because a missed case is costly.
KwickClips from this lesson
Short clips, one idea each. Good for revision the night before.
 Why is it called a confusion matrix?38 sec
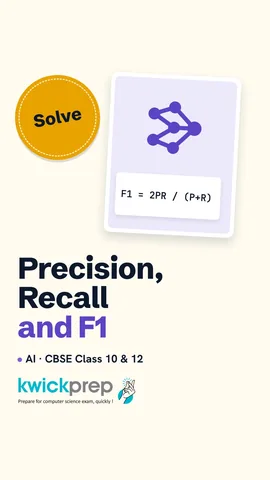 What is the F1 formula?43 sec
 Can a 99% accurate model be useless?42 sec
 Is a lower MSE better?41 sec
The full lesson, in text
Hello students, welcome to Kwickprep. A model that is ninety nine percent accurate sounds great. But what if it misses every single sick patient? Today we build a confusion matrix and calculate accuracy, precision, recall and F1 step by step. We also learn which metric to trust, and how to evaluate regression models.
First, a new term. A confusion matrix is a table that compares a model's predictions with reality. For a yes or no problem, it is a two by two table. It counts true positives, false positives, false negatives and true negatives. It shows exactly where the model gets confused.
Let us build one for a spam filter tested on one hundred emails. Positive here means spam, and negative means not spam. In reality, fifty emails are spam and fifty are not. The model correctly caught thirty spam emails, but missed twenty. It also wrongly flagged ten good emails as spam.
Now we fill the boxes. In the first row, the model predicted spam. Thirty were really spam, so true positive is thirty, and ten were not, so false positive is ten. In the second row, it predicted not spam. Twenty were really spam, so false negative is twenty, and the rest, forty, are true negatives. Check the totals: each column adds up to fifty, and all four boxes add up to one hundred.
Accuracy is the share of all predictions that were correct. The formula is true positives plus true negatives, divided by the total. Putting in values, thirty plus forty is seventy, divided by one hundred. So the accuracy is seventy percent.
Precision answers, when the model says spam, how often is it right? The formula is true positives divided by true positives plus false positives. Putting in values, thirty divided by thirty plus ten, which is thirty by forty. So precision is zero point seven five, or seventy five percent.
Recall answers, out of all the real spam, how much did the model catch? The formula is true positives divided by true positives plus false negatives. Putting in values, thirty divided by thirty plus twenty, which is thirty by fifty. So recall is zero point six, or sixty percent.
The F1 score combines precision and recall into one number, so a model cannot look good by doing well on only one. The formula is two times precision times recall, divided by precision plus recall. The top is two times zero point seven five times zero point six, which is zero point nine. The bottom is zero point seven five plus zero point six, which is one point three five. Zero point nine divided by one point three five is about zero point six seven.
Pause and predict. A hospital tests one thousand patients, and only ten are really sick. A lazy model simply says healthy for everyone. What are its accuracy and recall? It is right for nine hundred and ninety people, so accuracy is ninety nine percent. But it caught zero sick patients, so recall is zero.
So which metric should we trust? That depends on the problem. When yes and no cases are roughly equal and both mistakes cost the same, accuracy is fine. For a spam filter, a false positive loses an important email, so trust precision. For a disease test, a false negative misses a sick person, so trust recall. For fraud detection, where fraud is rare and both mistakes matter, use the F1 score.
One more kind of model to evaluate. Everything so far was classification, where the model predicts a class, like spam or not spam. Regression is when the model predicts a number, like a house price, marks or rainfall. For regression, there is no right or wrong box, so we measure how far the predictions are from the real values.
Here, a model predicts marks for four students. For the first, actual sixty, predicted sixty two, the error is two, and two squared is four. For the second, seventy and sixty eight, error two, squared four. For the third, eighty and eighty two, again four. For the fourth, ninety and eighty eight, again four. Mean squared error, or MSE, is the average of the squared errors, so sixteen divided by four is four. Root mean squared error, or RMSE, is its square root, which is two.
Why do we square the errors? Squaring makes every error positive, so plus two and minus two do not cancel out. Squaring also punishes big errors much more than small ones. RMSE brings the value back to the same unit as the data, so an RMSE of two means predictions are about two marks off. For both, lower is better, and zero means perfect predictions.
Finally, where does the evaluation data come from? We split the dataset into parts, and the exact shares can vary. The training set, about seventy percent, is what the model learns from. The validation set, about fifteen percent, helps us tune settings and choose the best model. The test set, about fifteen percent, is kept hidden until the end and gives the final, honest score.
Why not test on the training data? That is like giving students the exam paper in advance, the marks would look great but prove nothing. When a model does well on training data but poorly on new data, it is called overfitting, which means it memorised instead of learning. When data is small, we use cross-validation, where we split data into several parts and rotate which part is used for testing.
Let us revise what we learned today. A confusion matrix puts true positives, false positives, false negatives and true negatives in a two by two table. Accuracy is correct predictions over the total, and precision is true positives over all predicted positives. Recall is true positives over all real positives, and F1 balances precision and recall. Choose your metric by asking which mistake costs more. And for regression, use MSE and RMSE, always tested on data the model has never seen.
Courses that teach this
| Course | Unit |
|---|---|
| CBSE Class 10 Artificial Intelligence (417) | Part B Unit 3: Evaluating Models |
| CBSE Class 12 Artificial Intelligence (843) | Data Science Methodology - An Analytic Approach to Capstone Project |
Voice-over in this lesson is AI-generated. The script is written and checked by Kajal Ma'am. Boards can revise a syllabus mid-year, so confirm anything you plan around against the official board circular. Keep your passwords, OTPs and ID numbers to yourself — we never ask for them. To reach Kajal Ma'am, use the WhatsApp button; sharing your number there is how we call you back.
Free to watch, no sign-up. Live classes with Kajal Ma'am are the paid course; these lessons stay free either way.